
Exploring the Benefits of the Real-World Intro to Safe - Scaled Agile Framework
Paul Raybould is back with the final section of 'A Real-World intro to SAFe - Scaled Agile Framework' series.
Hello everyone!
Here’s the last part in my series on Scaled Agile Framework. In this last part, I cover a range of topics including Inspect and Adapt, Measuring Flow and other useful principles to consider. If you haven’t read the first two parts, do check out part 1 and part 2 before reading on.

Inspect and Adapt
As part of our PI cycle we also have an Inspect and Adapt session in every increment.
Teams and Stakeholders attend this session and it’s timeboxed to 3 or 4 hours. There are 3 main parts to this:
1. The PI System demo – Hands-on or video demos to reflect on what we have achieved and gain any feedback from anyone at the session.
2. Quantitative Measurement – How many stories did we deliver, how many points does this equate to, SLAs / KPIs met, is our Sprint Velocity still valid or do we need to change this?
3. Problem-solving workshop – How can we improve, what is impacting velocity and how can we remove impediments?
Other Useful Principles
WIP Limits – Kanban uses Work in Progress limits to increase flow. We don’t want everything hitting test in the last 2 days of a sprint so if we have hit the WIP limit of the number of stories or tasks ‘In Progress’ or ‘In Review’, then team members should not start a new ticket until this flow has been moved on (this could be nudging people to perform code reviews or testing stories / tasks).
WIP Limits can also be minimum or maximum values and can serve as buffers in controlling flow, some steps have no WIP limits applied.
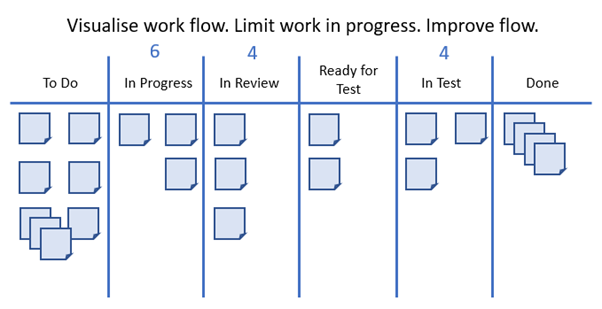
Keeping batch sizes small improves flow and reduces bottlenecks in the sprint cycle.
CALMR DevOps
Culture – Establish a shared responsibility culture for development, deployment and operations.
Automation – Automate the Continuous Delivery Pipeline.
Lean Flow – Keep batch sizes small, limit WIP and provide visibility at all stages.
Measurement – Measure the flow through the CD / CI pipeline and implement full stack telemetry where possible.
Recovery – Architect to enable low-risk releases with fast recovery and fix forward approach to bugs.
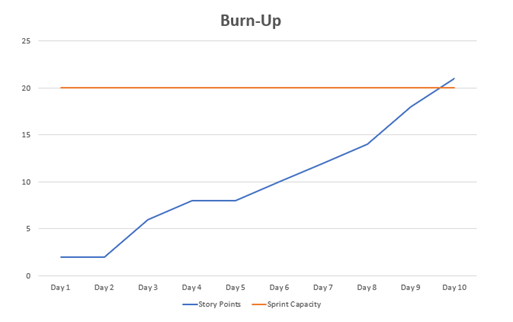
Measuring Flow
During a sprint cycle a ‘Burn Up’ chart is preferred as opposed to the usual ‘Burn Down’ chart.
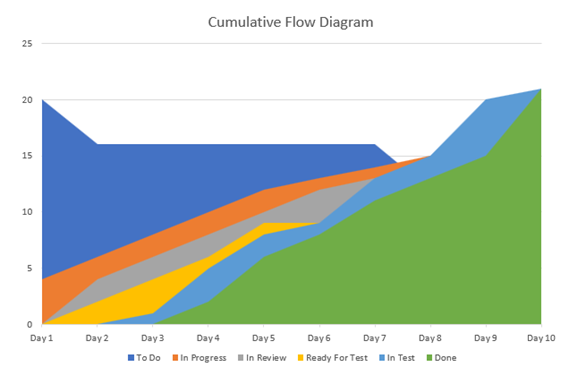
CFD – Cumulative Flow Diagram
These can be very useful for understanding WIP lead time or how long it is taking for a sprint item to progress from ‘In Progress’ to ‘Done’. This will also highlight any areas of improvement in terms of Flow.
Further Information
https://www.scaledagile.com/

.png)